
On April 16, 2024, the results of the 13th China Citizens' Science Literacy Sampling Survey were announced. The survey covered 31 provinces (autonomous regions, municipalities) and the Xinjiang Production and Construction Corps, 333 prefecture-level administrative units, and 86 districts and counties under the jurisdiction of municipalities directly under the Central Government, and the survey subjects were citizens aged 18 to 69 (excluding active military personnel). A total of 289,000 valid samples were collected.
The results show that in 2023, the proportion of Chinese citizens with scientific literacy reached 14.14%, an increase of 1.21 percentage points from 2022, showing an accelerating growth trend.
Results of the 13th Sampling Survey on Chinese Citizens’ Scientific Literacy
In order to thoroughly implement the spirit of the 20th National Congress of the Communist Party of China, implement the important instructions of General Secretary Xi Jinping on popular science and the construction of scientific literacy, implement the relevant arrangements of the "Opinions on Further Strengthening the Popularization of Science and Technology in the New Era" and the "Outline of the National Science Literacy Action Plan (2021-2035)" (hereinafter referred to as the "Scientific Literacy Outline"), strengthen the construction of national science popularization capabilities, and implement the national scientific literacy improvement action in depth, and provide reference for promoting high-quality population development to support Chinese-style modernization, the China Association for Science and Technology and the National Bureau of Statistics cooperated to carry out the 13th Chinese Citizens' Scientific Literacy Sampling Survey.
I. Basic Situation
This survey was approved by the National Bureau of Statistics' survey and statistics system (Guotongzhi [2023] No. 94). The survey plan was jointly designed by the Institute of Statistical Science of the National Bureau of Statistics, the Social Conditions and Public Opinion Survey Center, and the China Science Popularization Research Institute of the China Association for Science and Technology. The Social Conditions and Public Opinion Survey Center is responsible for the execution of the survey, and the China Science Popularization Research Institute is responsible for work coordination, quality control, and data processing.
This survey covers 31 provinces (autonomous regions and municipalities) and Xinjiang Production and Construction Corps, 333 prefecture-level administrative units and 86 districts and counties under the jurisdiction of municipalities directly under the Central Government (excluding Hong Kong, Macao and Taiwan). The survey subjects are citizens aged 18 to 69 (excluding active military personnel). The survey adopts a combination of offline home visits (computer-assisted face-to-face interview system) and online mobile phone text message push (computer-assisted network access system). This survey is designed to collect 300,000 online and offline samples. The China Science Popularization Research Institute, together with the Social Situation and Public Opinion Survey Center and a third-party professional quality control team, carefully planned, meticulously organized, strictly implemented, strictly controlled quality, and carefully calculated. After unremitting efforts by all parties, a total of 289,000 valid samples were collected, meeting the design requirements.
II. Main Results
1. Overall development
In 2023, the proportion of Chinese citizens with scientific literacy will reach 14.14%, an increase of 1.21 percentage points from 12.93% in 2022. Compared with the average annual increase of 1.05 percentage points in the later period of the 13th Five-Year Plan (2018-2020) and the average annual increase of 1.19 percentage points in the first part of the 14th Five-Year Plan (2021-2022), it shows an accelerating growth trend.
2. Urban and rural development
In 2023, the proportion of urban and rural residents with scientific literacy will reach 17.25% and 9.16% respectively, an increase of 1.31 and 1.20 percentage points from 2022, with growth rates of 8.22% and 15.08% respectively. The growth rate of rural residents' scientific literacy is higher than that of urban residents. The imbalance in the development of scientific literacy between urban and rural residents will be further alleviated.
3. Regional Development
In 2023, the proportion of citizens with scientific literacy in the eastern, central and western regions reached 16.39%, 13.12% and 11.51% respectively, an increase of 1.08, 1.15 and 1.24 percentage points from 2022. The gap in scientific literacy levels among citizens in the eastern, central and western regions narrowed for the first time.
4. Gender development
In 2023, the proportion of male and female citizens with scientific literacy will reach 15.66% and 12.53%, respectively, an increase of 0.89 and 1.55 percentage points from 2022, and the gender gap will narrow by 0.66 percentage points. Women's scientific literacy continues to improve rapidly, and the gender gap has further narrowed.
5. Age Development
By 2023, the proportion of people aged 18-29, 30-39, 40-49, 50-59 and 60-69 with scientific literacy will reach 25.72%, 19.00%, 13.23%, 8.52% and 4.45% respectively. The proportion of young people (18-29, 30-39) with scientific literacy has reached and is close to a high level of 20%, the proportion of middle-aged and elderly people (40-49, 50-59) with scientific literacy has reached and is close to 10%, and the elderly population (60-69) is still at a low level below 5%.
6. Development of different levels of education
In 2023, the proportion of people with a bachelor's degree or above who have scientific literacy will reach 43.99%, the proportion of citizens with a college education will be 25.17%, and the proportion of citizens with high school, junior high school and elementary school education and below who have scientific literacy will be 17.68%, 7.80% and 2.91% respectively. The level of citizens' scientific literacy shows a steep ascending ladder distribution as the level of education increases.
7. Citizens’ channels for obtaining scientific and technological information
Television and the Internet are still the two main channels for citizens to obtain scientific and technological information, with the selection ratios of 85.5% and 79.2% respectively. However, the "first choice" ratio of the Internet has increased from 56.2% in 2022 to 58.3%. Year-on-year, the "first choice" ratio of television has decreased from 31.0% to 26.8%. The gap between the two has further widened, and the status of the Internet as the primary channel for citizens to obtain scientific and technological information has been further strengthened.
8. Citizens’ use of science popularization infrastructure
Citizens are willing to visit four types of popular science infrastructure, including museums (zoos, aquariums, etc.), cultural (cultural centers, libraries, etc.), science and technology venues (science and technology museums, etc.), and scientific and technological innovation venues (laboratories, exhibition rooms, etc.). In terms of visit willingness and effect, "science and technology venues such as science and technology museums" have the highest "first choice" visit rate among all popular science infrastructure, with a selection rate of 44.8%, and also the highest proportion of citizens who think they "gained something" after visiting, with a selection rate of 82.1%. In terms of visiting behavior, the proportion of citizens visiting museums and cultural venues is relatively high, with 65.1% and 62.3% of them having visited in the past year respectively, and the proportion of visiting science and technology venues has also reached 40.2%. Considering that the construction quantity and exhibition hall area intensity of the first two types of venues are much higher than those of science and technology venues, science and technology venues have a higher visit efficiency among various types of popular science infrastructure.
Regarding the motivations for visiting and using various types of science popularization infrastructure, the proportion of those who chose "interested in themselves" and "going with relatives and friends" was relatively high. Among the factors that restrict the visit and use of various types of science popularization infrastructure, the proportion of "no time" and "remote location" was significantly higher than the others, indicating that actively mobilizing citizens to participate in science popularization and optimizing the layout and services of science popularization infrastructure are still important means to achieve high-quality development of scientific literacy construction.
Citizens are willing to visit and use science and technology infrastructure. Among all types of science and technology infrastructure, science and technology venues represented by science and technology museums have the highest visiting willingness and usage efficiency.
9. Citizens’ attitude towards scientific and technological development
The percentage of citizens who agree with the views such as "the public's understanding and support for scientific and technological innovation is the foundation for building a strong country in science and technology", "modern science and technology will provide more development opportunities for our descendants", and "although it cannot produce immediate benefits, basic scientific research is necessary" are 89.2%, 89.0% and 87.4% respectively, which is a slight decrease compared with 91.0%, 91.8% and 90.1% in 2022. The percentage of citizens who agree with the views such as "the continuous application of technology will eventually destroy the earth on which we depend for survival" and "the government should allow the public to participate more effectively in scientific and technological decision-making through various means such as holding hearings" are 35.6% and 89.7% respectively, which is a slight increase compared with 33.8% and 87.7% in 2022. Citizens maintain a high level of attention and active support for scientific and technological innovation, and their concerns about the risks of new technology applications and willingness to participate in scientific and technological decision-making have increased. The above changes, such as a slight decline in positive attitudes and a slight increase in concerns, need to be further observed and studied over a longer time span.
Related charts of the 13th China Citizens' Science Literacy Sampling Survey
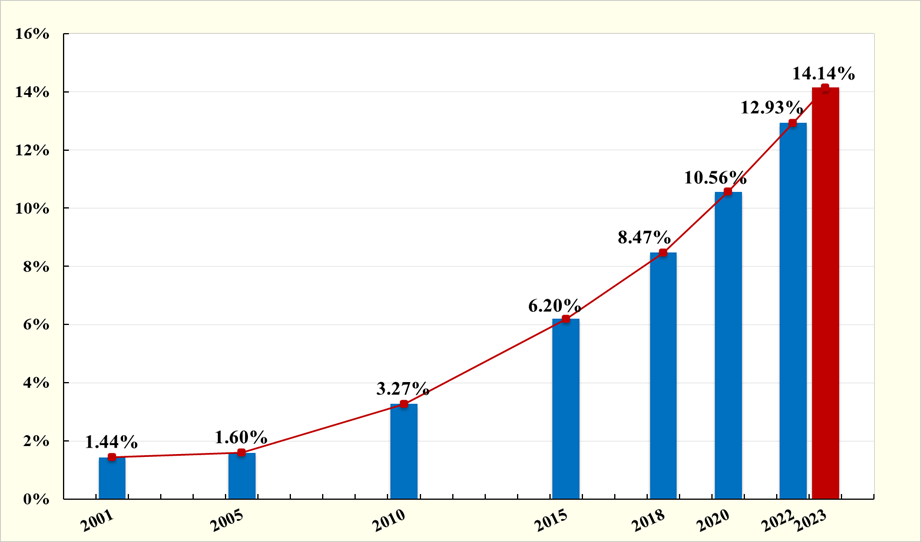
Figure 1 Development of citizens’ scientific literacy
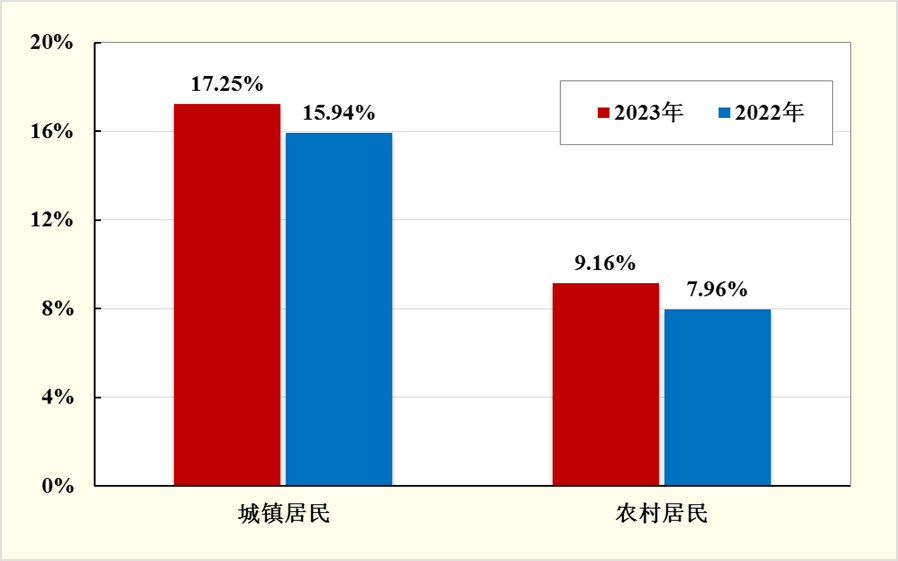
Figure 2 Development of scientific literacy among urban and rural residents
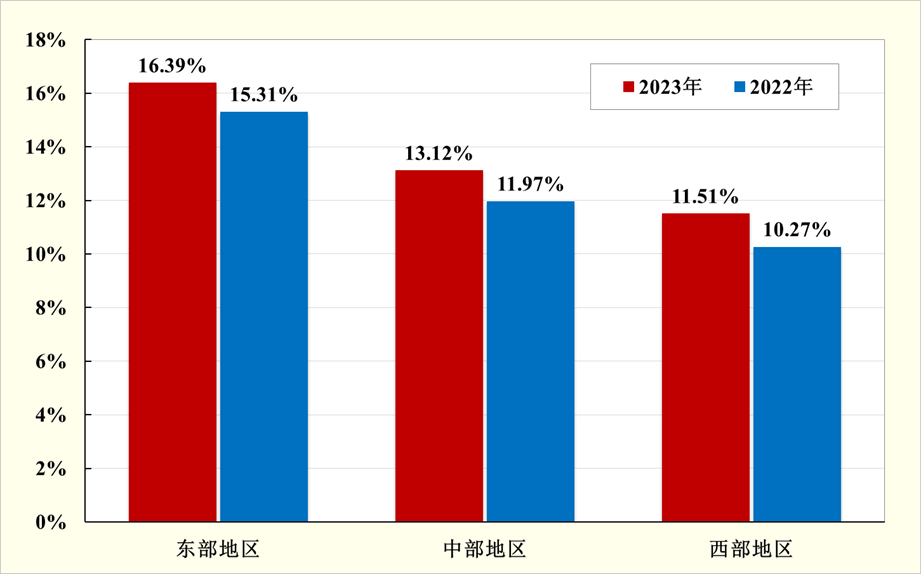
Figure 3 Development of scientific literacy in the east, middle and west

Figure 4 The development of scientific literacy among citizens of different genders
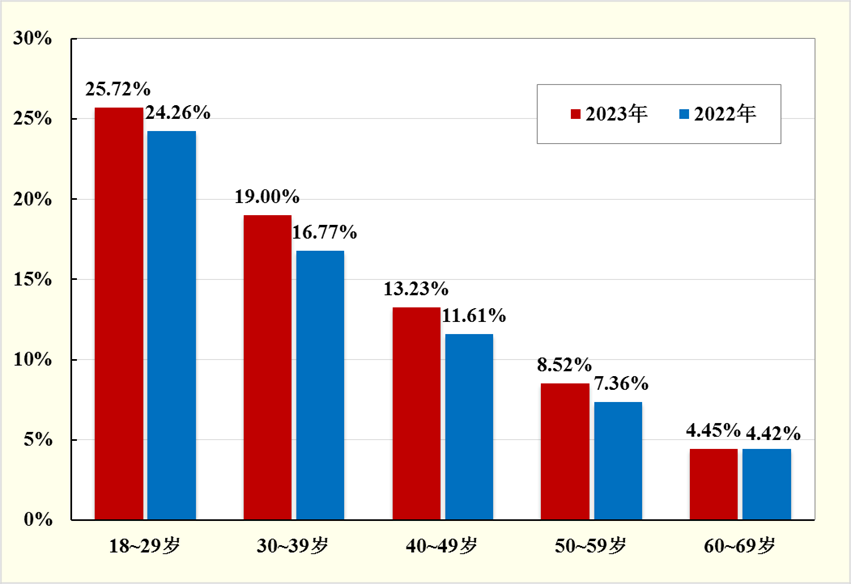
Figure 5 The development of scientific literacy among citizens of different age groups
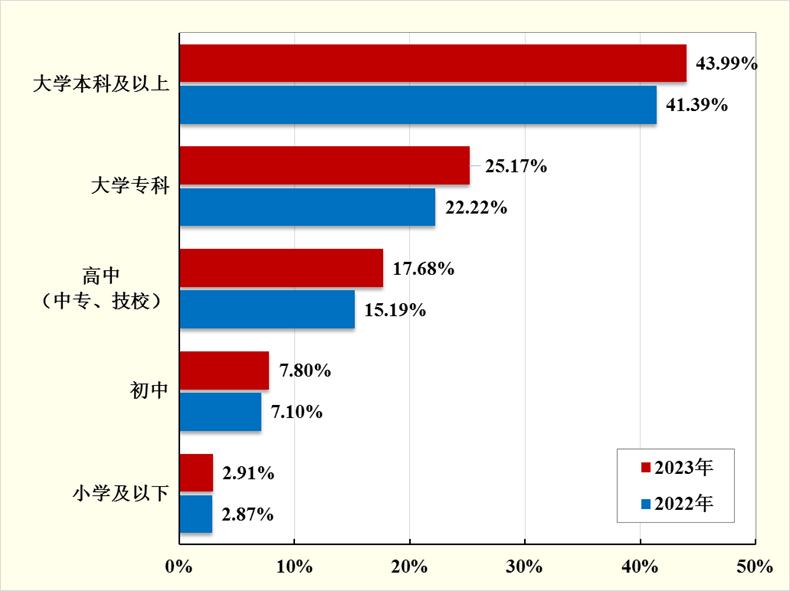
Figure 6 Development of scientific literacy among citizens with different educational levels
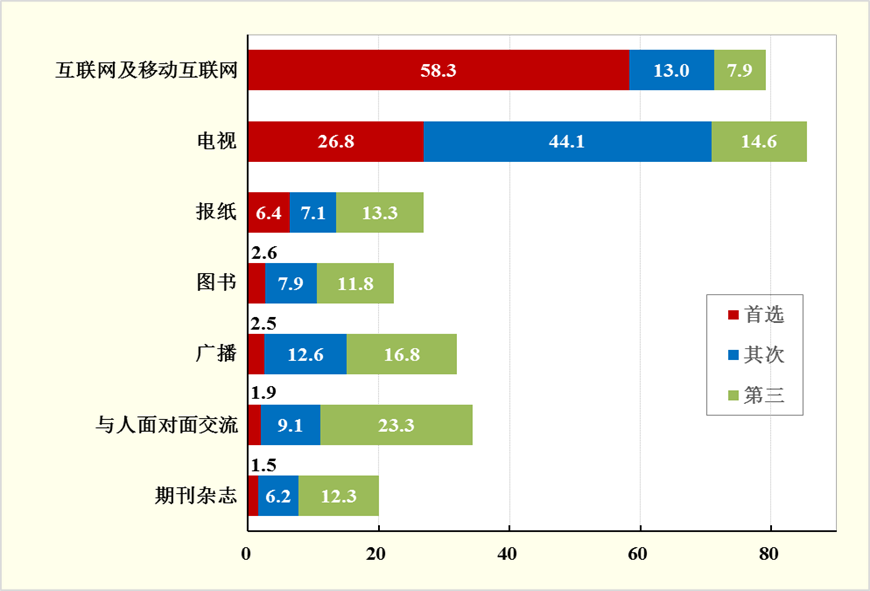
Figure 7 Citizens’ channels for obtaining scientific and technological information (%)
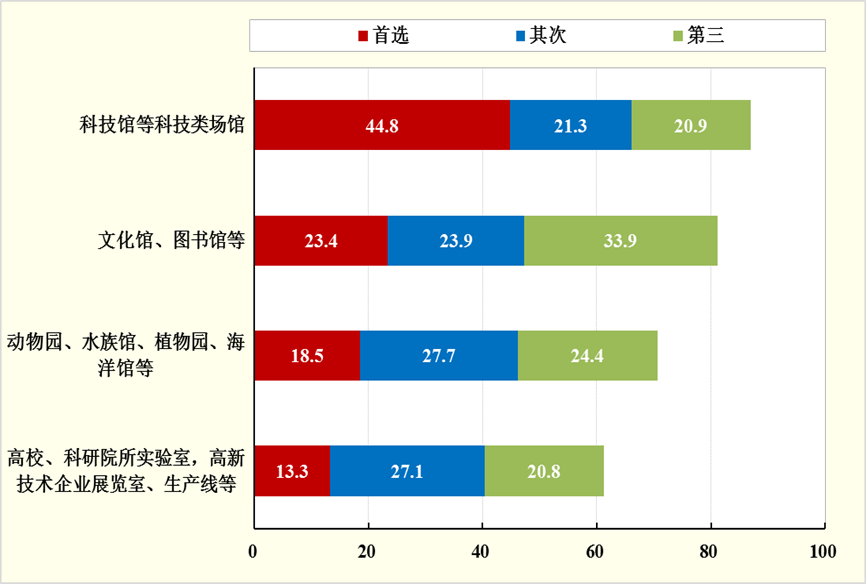
Figure 8 Citizens’ willingness to use science popularization facilities (%)
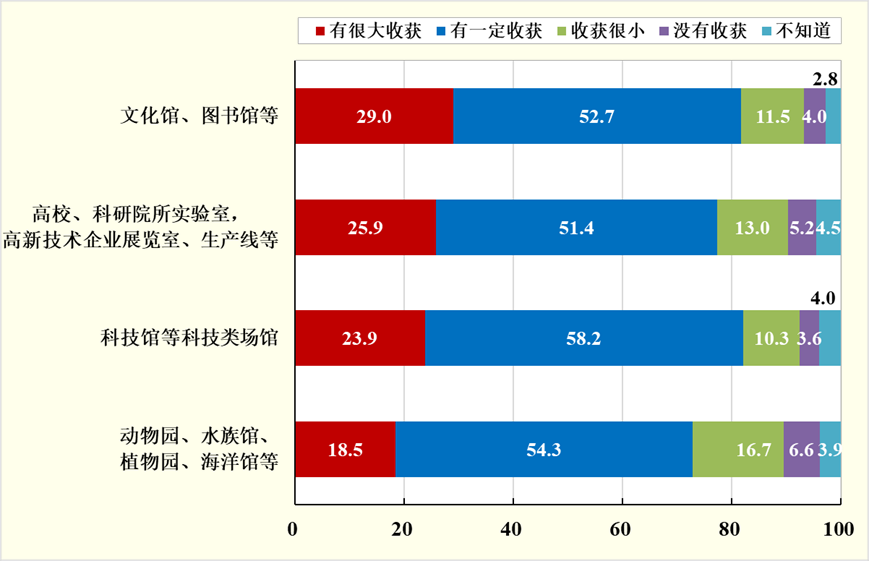
Figure 9 What citizens gain from using science popularization facilities (%)
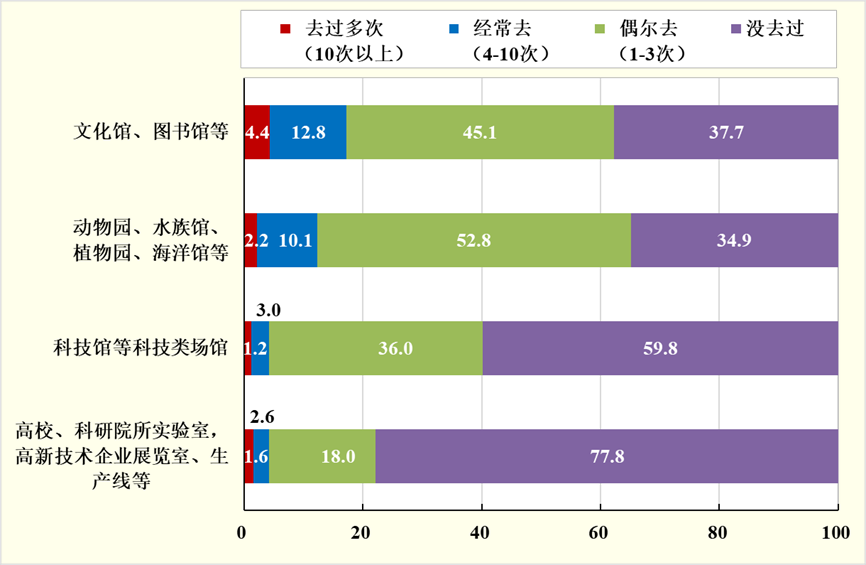
Figure 10 Citizens’ use of science popularization facilities (%)
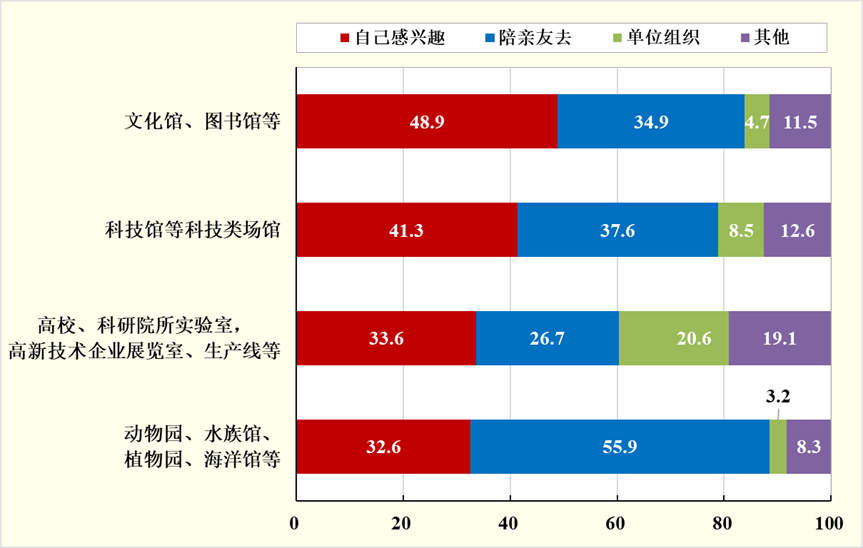
Figure 11 Citizens’ motivations for using science popularization facilities (%)
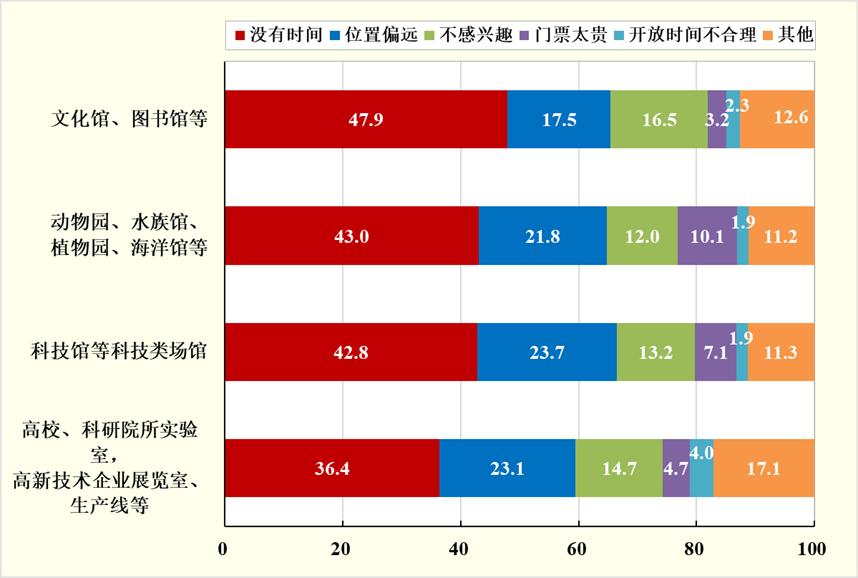
Figure 12 Factors restricting citizens’ use of science popularization facilities (%)
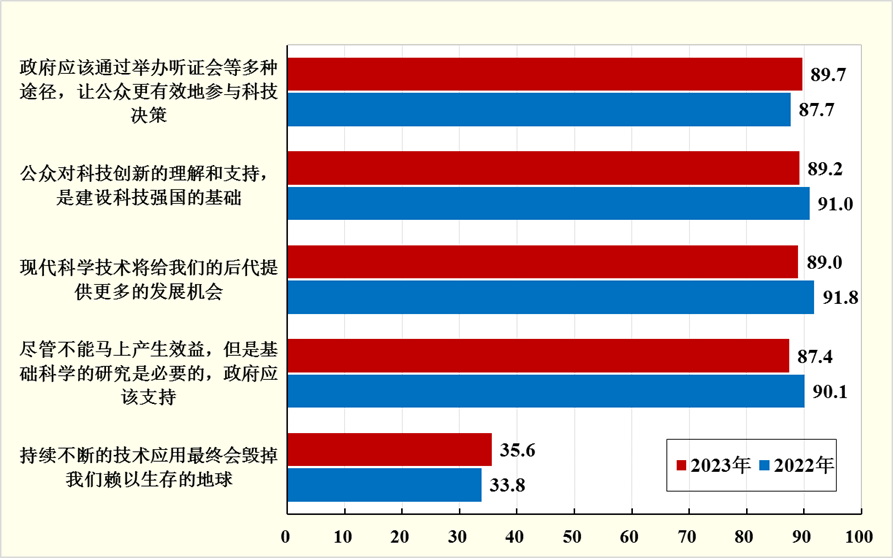
Figure 13 Citizens’ attention and support for scientific and technological innovation (%)